At a glance
1 · The method — George Antone's three buckets (Fynanc Academy)
| Bucket | Target | Job | Selection criteria (priority order) |
|---|---|---|---|
| Bedrock | 65% | Stability first. Low drawdown, low correlation, low maintenance. Yield is bonus, not goal. | price stability · max drawdown · market correlation · maintenance requirement · yield |
| Cash Flow | 34% | High yield engine. Accept NAV erosion and higher volatility for income generation. | yield · dividend reliability · spread |
| Hedge | 1% | Portfolio insurance. Moves opposite direction. Asymmetric bets. Tiny allocation. | negative correlation · asymmetric payoff |
Source: Fynanc Academy PLEX strategy (George Antone). Principle: stability first — Bedrock is the base, the yield engine sits on top, the hedge is a tiny asymmetric insurance sleeve.
2 · Every holding, bucketed
| Ticker | Fund | Type | Wt | Filed as | PLEX criteria say |
|---|---|---|---|---|---|
| JAAA | Janus AAA CLO ETF | AAA CLO ETF | 11.7% | Bedrock | Bedrock |
| SCHD | Schwab US Dividend Equity | Dividend-equity ETF | 7.8% | Bedrock | Bedrock |
| HIGH | Simplify Enhanced Income | Option-income bond ETF | 5.85% | Bedrock | Bedrock |
| JPIE | JPMorgan Income ETF | Short-dur multisector bond | 5.85% | Bedrock | Bedrock |
| AMLP | Alerian MLP ETF | MLP/energy infra ETF | 5.2% | Bedrock | Bedrock |
| NEA | Nuveen AMT-Free Muni Credit | Muni-bond CEF | 5.2% | Bedrock | Bedrock |
| SRLN | SPDR Blackstone Senior Loan | Senior-loan ETF | 5.2% | Bedrock | Bedrock |
| PFFD | Global X US Preferred | Preferred ETF | 3.9% | Bedrock | Bedrock |
| QDTE | Roundhill Innovation 0DTE | 0DTE covered-call ETF | 8.05% | Cash Flow | Cash Flow |
| SVOL | Simplify Volatility Premium | Short-vol income ETF | 5.95% | Cash Flow | Cash Flow |
| PDI | PIMCO Dynamic Income | HY/leveraged CEF | 5.85% | Bedrock | Cash Flow ⚠️ |
| QQQI | NEOS Nasdaq 100 High Income | Nasdaq covered-call ETF | 5.25% | Cash Flow | Cash Flow |
| BIZD | VanEck BDC Income | BDC basket ETF | 5.2% | Bedrock | Cash Flow ⚠️ |
| SPYI | NEOS S&P 500 High Income | S&P covered-call ETF | 4.9% | Cash Flow | Cash Flow |
| CLM | Cornerstone Strategic Value | Equity CEF (high ROC) | 3.85% | Cash Flow | Cash Flow |
| RYLD | Global X Russell 2000 Covered Call | Covered-call ETF | 3.15% | Cash Flow | Cash Flow |
| RQI | Cohen & Steers Quality Income Realty | Real-estate CEF | 1.95% | Bedrock | Cash Flow ⚠️ |
| ACV | Allianzgi Diversified Income & Conv | Convertible CEF | 1.3% | Bedrock | Cash Flow ⚠️ |
| NVDY | YieldMax NVDA Option Income | Single-stock option income | 1.4% | Cash Flow | Hedge ⚠️ |
| PLTY | YieldMax PLTR Option Income | Single-stock option income | 1.4% | Cash Flow | Hedge ⚠️ |
| YMAG | YieldMax Mag-7 Option Income | Fund-of-option-income ETF | 1.05% | Cash Flow | Hedge ⚠️ |
This portfolio came pre-bucketed, so §2 doubles as a scorecard: Filed as vs what the PLEX criteria say. ⚠️ marks a disagreement.
Buckets assigned by fund type/strategy against the PLEX criteria above.
3 · This portfolio vs the method — the gap
As built:
Bedrock 50.7% (8) · Cash Flow 45.4% (10) · Hedge 3.8% (3)
PLEX target:
Bedrock 65% · Cash Flow 34% · Hedge 1%
- PDI — filed under Bedrock; by George's criteria it's Cash Flow.
- BIZD — filed under Bedrock; by George's criteria it's Cash Flow.
- RQI — filed under Bedrock; by George's criteria it's Cash Flow.
- ACV — filed under Bedrock; by George's criteria it's Cash Flow.
- NVDY — filed under Cash Flow; by George's criteria it's Hedge.
- PLTY — filed under Cash Flow; by George's criteria it's Hedge.
- YMAG — filed under Cash Flow; by George's criteria it's Hedge.
4 · The selection guardrails — how a holding earns "Bedrock"
- Correlation to the S&P 500 — Bedrock wants low (its own clock, not the market's).
- Standard deviation — Bedrock wants low volatility (a senior-loan CEF qualifies; a CLO-equity or 0DTE option fund does not).
- Maintenance requirement — holdable without heavy margin cost.
- Distribution reliability & how much is return-of-capital — high ROC erodes NAV; it isn't real income.
- Yield is the LAST criterion — "a bonus, not the goal."
Source: Fynanc Academy — PLEX Community Call, "Bedrock Debt-Based Candidates v2.0" (Apr 16, 2025).
5 · What an "ideal" PLEX version looks like
Same income objective, but stability-first and hedged (weights are within each bucket):
Bedrock — 65%
| Ticker | Fund | Type | Yield | Wt | Action |
|---|---|---|---|---|---|
| UTG | Reaves Utility Income Fund | CEF | 5.7% | 15% | KEEP |
| UTF | Cohen & Steers Infrastructure Fund | CEF | 7.5% | 12% | KEEP |
| NML | Neuberger Berman Energy Infrastructure & Income Fund | CEF | 8.6% | 12% | KEEP |
| VVR | Invesco Senior Income Trust | CEF | 5% | 10% | GROW |
| BKLN | Invesco Senior Loan ETF | ETF | 5% | 10% | GROW |
| FTSL | First Trust Senior Loan ETF | ETF | 7% | 10% | GROW |
| FLRT | Pacer Pacific Ridge Floating Rate High Income ETF | ETF | 6.5% | 10% | GROW |
| TBIL | US Treasury 3-Month Bill ETF | ETF | 4% | 12% | ADD |
| NIE | Virtus Equity & Convertible Income Fund | CEF | 7.9% | 9% | KEEP |
Cash Flow — 34%
| Ticker | Fund | Type | Yield | Wt | Action |
|---|---|---|---|---|---|
| KIO | KKR Income Opportunities Fund | CEF | 13.1% | 18% | KEEP |
| RLTY | Cohen & Steers Real Estate Opportunities & Income Fund | CEF | 8.6% | 14% | KEEP |
| BBDC | Barings BDC | BDC | 11.8% | 16% | KEEP |
| PBDC | Putnam BDC Income ETF | ETF | 10% | 14% | KEEP |
| ASG | Liberty All-Star Growth Fund | CEF | 8.4% | 12% | KEEP |
| FSCO | FS Credit Opportunities Corp | CEF | 13.5% | 10% | MONITOR |
Hedge — 1%
| Ticker | Fund | Type | Yield | Wt | Action |
|---|---|---|---|---|---|
| YMAX | YieldMax Universe Fund of Option Income ETFs | ETF | 47% (mostly ROC) | 55% | ADD |
| YMAG | YieldMax Magnificent 7 Fund of Option Income ETFs | ETF | 48% (mostly ROC) | 45% | ADD |
Model picks & actions per the Fynanc Academy PLEX tier model.
6 · What a holdings-only view CANNOT see
- Dollar amounts & position sizes — only target % weights.
- Cost basis & realized vs return-of-capital income — critical for these funds; needs fund-level data.
- Drawdown history & the investor's real experience.
- Cash, contributions, rebalancing, taxes.
Treat the bucketing as a structural read (what jobs the holdings do), not a statement about returns. No login was requested or needed.
Yield & Risk — answering Amir (live)
This is the live, code-computed answer to the questions Amir's group asks: what is the real blended yield, how deep does it draw down versus the S&P 500, and how much of the "income" is actually return-of-capital? Every number below comes from code (yfinance total-return + distribution data), not estimates. Computed 2026-06-11T10:50:00.120326+00:00.
1 · Weighted yield. Headline 15.0% (sanity-capped) · raw uncapped 19.05% · coverage 100.0% (21/21 holdings priced). The raw figure includes data-feed outliers (QQQI (57.0%), NVDY (62.38%), PLTY (99.24%)) that breach the 50.0% sanity cap; the headline figure caps those, so it is the honest one to quote.
2 · Drawdown vs the S&P 500 (total-return, window 2023-06-12 → 2026-06-10; benchmark SPY).
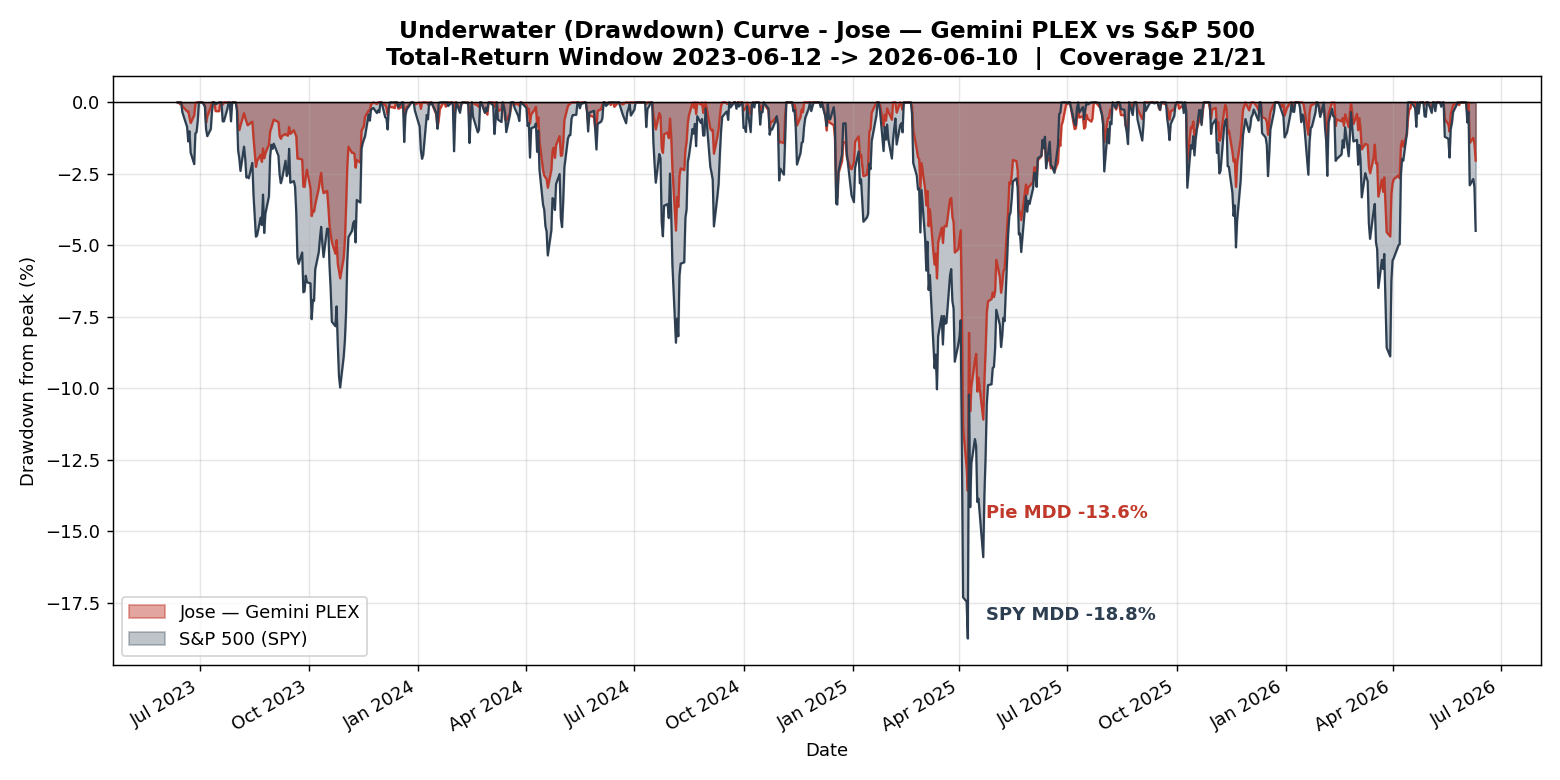
| Metric | This portfolio | S&P 500 (SPY) |
|---|---|---|
| Max drawdown | -13.59% | -18.76% |
| Annualized volatility | 9.08% | 15.2% |
| Total return (window) | 41.91% | 73.78% |
| Sharpe (rf=0) | 1.339 | 1.296 |
| Beta vs SPY | 0.561 | 1.00 |
| Correlation vs SPY | 0.939 | 1.00 |
Honest caveat: 4 holding(s) have less than the full window of price history (PLTY, QDTE, QQQI, YMAG); the engine renormalizes weights daily so each ticker only counts from its own start date — no fabricated history. Coverage 21/21, all priced.
3 · Income quality — how much is really earned vs return-of-capital? (total-return-coverage proxy; LIKELY-ROC = distribution rate exceeds 1y total return by >3pp. Coverage 100.0%.)
Earned 50.3% · Mixed 5.8% · Likely-ROC 43.8% (by portfolio weight)
Riskiest high-yield holdings (payout outran earnings — NAV-erosion signal):
| Ticker | Fund | Wt | Dist rate | Total ret 1y | Why flagged |
|---|---|---|---|---|---|
| PLTY | YieldMax PLTR Option Income | 1.4% | 120.33% | -3.94% | dist rate 120.3% exceeds total return -3.9% by 124.3pp — payout outran earnings (NAV-erosion signal) |
| NVDY | YieldMax NVDA Option Income | 1.4% | 66.78% | 35.74% | dist rate 66.8% exceeds total return 35.7% by 31.0pp — payout outran earnings (NAV-erosion signal) |
| YMAG | YieldMax Mag-7 Option Income | 1.05% | 54.79% | 18.9% | dist rate 54.8% exceeds total return 18.9% by 35.9pp — payout outran earnings (NAV-erosion signal) |
| QDTE | Roundhill Innovation 0DTE | 8.05% | 46.04% | 29.96% | dist rate 46.0% exceeds total return 30.0% by 16.1pp — payout outran earnings (NAV-erosion signal) |
| SVOL | Simplify Volatility Premium | 5.95% | 24.58% | 8.71% | dist rate 24.6% exceeds total return 8.7% by 15.9pp — payout outran earnings (NAV-erosion signal) |
Sources: yield from the weighted-yield engine (yfinance distributions, sanity-capped); drawdown/vol/Sharpe/beta from total-return price history vs SPY over the shared 3-year window; income-quality from the distribution-sustainability (ROC) engine. This is a total-return-coverage proxy for ROC, not a read of each fund's official 19(a) notice. Honest by construction: short-history and data-feed outliers are disclosed above, not hidden.
7 · Key terms & sources
| Term | Meaning here | Where it's taught (course · session · date) |
|---|---|---|
| Bedrock | Stability bucket — low drawdown/correlation/maintenance. Target ~65%. | PLEX · "Bedrock Debt-Based Candidates v2.0" · Apr 16, 2025 (PLEX tier model) |
| Cash Flow | Yield engine — accepts volatility & NAV erosion for income. Target ~34%. | PLEX · Call 2 "PLEX Portfolio" · Feb 2, 2026 (PLEX tier model) |
| Hedge | Tiny asymmetric insurance sleeve. Target ~1%. | PLEX · "The Ultimate Hedge Against Inflation" · Sep 2024 |
| 0DTE / weekly covered call | ETFs selling very-short-dated options for high income; high ROC, capped upside. | General market product — referenced in PLEX portfolio examples |
| YieldMax / single-stock option income | Asymmetric option-income on one stock (NVDA, TSLA…). Hedge-tier by risk. | General market product — used as PLEX Hedge-tier examples |
| CLO equity | Riskiest CLO tranche (OXLC/ECC/OCCI/CCIF) — high yield, equity-like risk → Cash Flow, not Bedrock. | PLEX · "Bedrock Debt-Based Candidates v2.0" · Apr 16, 2025 (CLO candidates listed) |
| ROC | Return of capital — your own money handed back as "yield"; erodes NAV. | PLEX · "Income Sources — Advanced: Open-End Funds (Part 2)" |
| Correlation / Standard deviation | The volatility & market-linkage screens that decide Bedrock vs Cash Flow. | PLEX · "Qualifying New Income Sources" · May 4, 2022 · scored in "Bedrock Candidates v2.0" · Apr 16, 2025 |
Sources (Fynanc Academy): PLEX Community Call — "Bedrock Debt-Based Candidates v2.0" (Apr 16, 2025); PLEX tier model (Bedrock/Cash-Flow/Hedge targets & model picks, George Antone); "The Ultimate Hedge Against Inflation" (Sep 2024). Holdings read from the shared portfolio link.