At a glance — the "Income Factory" pie
A high-income portfolio built almost entirely from closed-end funds (CEFs), business-development companies (BDCs), CLOs and credit vehicles — engineered for high current distributions (~9.78%), spread thin and even across 53 names.
1 · The method — George Antone's three buckets (Fynanc Academy)
The PLEX method doesn't ask "is this a good fund?" It asks "what job does each holding do," and sorts every position into one of three buckets with a target weight:
| Bucket | Target | Job | Selection criteria (in priority order) |
|---|---|---|---|
| Bedrock | 65% | Stability first. Low drawdown, low correlation, low maintenance. Yield is bonus, not goal. | price stability · max drawdown · market correlation · maintenance requirement · yield |
| Cash Flow | 34% | High yield engine. Accept NAV erosion and higher volatility for income generation. | yield · dividend reliability · spread |
| Hedge | 1% | Portfolio insurance. Moves opposite direction. Asymmetric bets. Tiny allocation. | negative correlation · asymmetric payoff |
Source: Fynanc Academy — PLEX strategy. Tier targets & criteria per the PLEX tier configuration (George Antone / Fynanc PLEX criteria). The principle George repeats: stability first — Bedrock is the base, the yield engine sits on top of it, and the hedge is a tiny asymmetric insurance sleeve.
2 · Every holding, bucketed (all 53)
| Ticker | Fund | Type | Wt | Bucket |
|---|---|---|---|---|
| ASGI | abrdn Global Infrastructure | Infrastructure CEF | 2% | Bedrock |
| DNP | DNP Select Income (utilities/income) | Utility Income CEF | 2% | Bedrock |
| EMO | ClearBridge Energy Midstream Opportunity | MLP/Energy Infra CEF | 2% | Bedrock |
| FFC | Flaherty & Crumrine Preferred Income | Preferred Securities CEF | 2% | Bedrock |
| HTD | John Hancock Tax-Adv Dividend (util/fin) | Utility/Dividend CEF | 2% | Bedrock |
| JRI | Nuveen Real Asset Income & Growth | Real Assets/Infra CEF | 2% | Bedrock |
| MLPI | NEOS MLP & Energy Infrastructure High Income ETF | MLP/Energy Infra ETF | 2% | Bedrock |
| NIE | Virtus Equity & Convertible Income | Equity/Convertible+Cov-Call CEF | 2% | Bedrock |
| NML | Neuberger Berman Energy Infrastructure & Income | Energy Infra CEF | 2% | Bedrock |
| NPFD | Nuveen Variable Rate Preferred & Income | Preferred CEF | 2% | Bedrock |
| SRV | NXG Cushing Midstream Energy | MLP/Energy Infra CEF | 2% | Bedrock |
| TYG | Tortoise Energy Infrastructure | MLP/Energy Infra CEF | 2% | Bedrock |
| UTF | Cohen & Steers Infrastructure | Infrastructure CEF | 2% | Bedrock |
| UTG | Reaves Utility Income | Utility CEF | 2% | Bedrock |
| PAAA | PGIM AAA CLO ETF | AAA CLO ETF | 1% | Bedrock |
| ADX | Adams Diversified Equity Fund | Equity CEF | 2% | Cash Flow |
| AOD | abrdn Total Dynamic Dividend | Covered-Call Equity CEF | 2% | Cash Flow |
| AWP | abrdn Global Premier Properties (REIT) | Real Estate CEF | 2% | Cash Flow |
| BBDC | Barings BDC | BDC | 2% | Cash Flow |
| BCSF | Bain Capital Specialty Finance | BDC | 2% | Cash Flow |
| BDJ | BlackRock Enhanced Equity Dividend | Covered-Call Equity CEF | 2% | Cash Flow |
| BGH | Barings Global Short Duration High Yield | HY Bond CEF | 2% | Cash Flow |
| BXSL | Blackstone Secured Lending | BDC (senior secured) | 2% | Cash Flow |
| CLOZ | Eldridge BBB-B CLO ETF | CLO mezzanine ETF | 2% | Cash Flow |
| DOGG | FT Vest DJIA Dogs 10 Target Income ETF | Covered-Call/Income ETF | 2% | Cash Flow |
| ETG | Eaton Vance Tax-Adv Global Dividend Income | Equity CEF | 2% | Cash Flow |
| EXG | Eaton Vance Tax-Mgd Global Div Equity Income | Covered-Call Equity CEF | 2% | Cash Flow |
| FSCO | FS Credit Opportunities | HY Credit CEF | 2% | Cash Flow |
| GDV | Gabelli Dividend & Income | Equity CEF | 2% | Cash Flow |
| GHY | PGIM Global High Yield | HY Bond CEF | 2% | Cash Flow |
| GOF | Guggenheim Strategic Opportunities | Multi-sector Credit CEF | 2% | Cash Flow |
| GPIQ | Goldman Sachs Nasdaq-100 Premium Income | Covered-Call ETF | 2% | Cash Flow |
| GPIX | Goldman Sachs S&P 500 Premium Income | Covered-Call ETF | 2% | Cash Flow |
| HYT | BlackRock Corporate High Yield | HY Bond CEF | 2% | Cash Flow |
| IDVO | Amplify CWP Intl Enhanced Dividend Income | Covered-Call ETF | 2% | Cash Flow |
| MCN | Madison Covered Call & Equity Strategy | Covered-Call Equity CEF | 2% | Cash Flow |
| MSDL | Morgan Stanley Direct Lending | BDC | 2% | Cash Flow |
| NFJ | Virtus Dividend Interest & Premium | Covered-Call Equity CEF | 2% | Cash Flow |
| PAXS | PIMCO Access Income | Multi-sector Credit CEF | 2% | Cash Flow |
| PDI | PIMCO Dynamic Income | HY/Multi-sector CEF | 2% | Cash Flow |
| PDO | PIMCO Dynamic Income Opportunities | HY Credit CEF | 2% | Cash Flow |
| PEO | Adams Natural Resources Fund | Equity/Energy CEF | 2% | Cash Flow |
| PFFA | Virtus InfraCap U.S. Preferred (leveraged) | Leveraged Preferred ETF | 2% | Cash Flow |
| PTY | PIMCO Corporate & Income Opportunity | HY Credit CEF | 2% | Cash Flow |
| RMT | Royce Micro-Cap Trust | Small-cap Equity CEF | 2% | Cash Flow |
| RVT | Royce Value Trust | Small-cap Equity CEF | 2% | Cash Flow |
| STK | Columbia Seligman Premium Technology Growth | Equity Tech CEF | 2% | Cash Flow |
| THW | abrdn World Healthcare | Healthcare Equity CEF | 2% | Cash Flow |
| ECC | Eagle Point Credit (CLO equity) | CLO Equity CEF | 1% | Cash Flow |
| EIC | Eagle Point Income (CLO debt BB) | CLO Debt CEF | 1% | Cash Flow |
| OTF | Blue Owl Technology Finance | BDC | 1% | Cash Flow |
| OXLC | Oxford Lane Capital (CLO equity) | CLO Equity CEF | 1% | Cash Flow |
| XFLT | XAI Octagon Floating Rate & Alt Income | CLO/Loan CEF | 1% | Cash Flow |
Buckets assigned by fund type/sector against the PLEX criteria above: utilities, infrastructure/MLP, senior loans, AAA CLO and preferred → Bedrock; BDCs, high-yield credit, equity-income/covered-call, CLO-equity and REITs → Cash Flow; asymmetric options-income → Hedge.
3 · This pie vs the method — the gap
The pie as built (53 holdings):
Bedrock 29% (15 funds) · Cash Flow 71% (38 funds) · Hedge 0% (0 funds)
The PLEX target:
Bedrock 65% · Cash Flow 34% · Hedge 1%
4 · The selection guardrails — how a holding earns "Bedrock"
Bedrock isn't "low risk by vibe." In the Academy's candidate sheet, each fund is scored on hard columns before it qualifies:
- Correlation to the S&P 500 — Bedrock wants low (moves on its own clock, not with the stock market).
- Standard deviation — Bedrock wants low volatility (e.g., a senior-loan CEF at ~4 SD qualifies; a CLO-equity fund at ~18 SD does not).
- Maintenance requirement — can the broker hold it without heavy margin cost (XFLT's 100% requirement disqualifies it).
- Distribution frequency & reliability — monthly & consistent preferred.
- Morningstar rating — a sanity tiebreaker, not the driver.
Example from the candidate sheet: "ECC — pass as a bedrock holding due to high SD / distribution frequency, or place in Cash-Flow assets due to low SD/correlation/maintenance." Yield is explicitly the last Bedrock criterion — "yield is a bonus, not the goal." Source: Fynanc Academy — PLEX Community Call, "Bedrock Debt-Based Candidates v2.0" (Apr 16, 2025).
5 · What an "ideal" PLEX version would look like
Using the live picture from this pie plus the Academy's own model picks, here is the shape the method points to — same income objective, but stability-first and hedged. (Weights below are within each bucket.)
Bedrock — 65% of the portfolio (stability: utilities, infrastructure, senior loans, AAA CLO, treasuries)
| Ticker | Fund | Type | Yield | Wt in tier | Action |
|---|---|---|---|---|---|
| UTG | Reaves Utility Income Fund | CEF | 5.7% | 15% | KEEP |
| UTF | Cohen & Steers Infrastructure Fund | CEF | 7.5% | 12% | KEEP |
| NML | Neuberger Berman Energy Infrastructure & Income Fund | CEF | 8.6% | 12% | KEEP |
| VVR | Invesco Senior Income Trust | CEF | 5% | 10% | GROW |
| BKLN | Invesco Senior Loan ETF | ETF | 5% | 10% | GROW |
| FTSL | First Trust Senior Loan ETF | ETF | 7% | 10% | GROW |
| FLRT | Pacer Pacific Ridge Floating Rate High Income ETF | ETF | 6.5% | 10% | GROW |
| TBIL | US Treasury 3-Month Bill ETF | ETF | 4% | 12% | ADD |
| NIE | Virtus Equity & Convertible Income Fund | CEF | 7.9% | 9% | KEEP |
Cash Flow — 34% of the portfolio (the yield engine: BDCs, high-yield credit, equity income)
| Ticker | Fund | Type | Yield | Wt in tier | Action |
|---|---|---|---|---|---|
| KIO | KKR Income Opportunities Fund | CEF | 13.1% | 18% | KEEP |
| RLTY | Cohen & Steers Real Estate Opportunities & Income Fund | CEF | 8.6% | 14% | KEEP |
| BBDC | Barings BDC | BDC | 11.8% | 16% | KEEP |
| PBDC | Putnam BDC Income ETF | ETF | 10% | 14% | KEEP |
| ASG | Liberty All-Star Growth Fund | CEF | 8.4% | 12% | KEEP |
| FSCO | FS Credit Opportunities Corp | CEF | 13.5% | 10% | MONITOR |
Hedge — 1% of the portfolio (tiny asymmetric insurance sleeve)
| Ticker | Fund | Type | Yield | Wt in tier | Action |
|---|---|---|---|---|---|
| YMAX | YieldMax Universe Fund of Option Income ETFs | ETF | 47% (mostly ROC) | 55% | ADD |
| YMAG | YieldMax Magnificent 7 Fund of Option Income ETFs | ETF | 48% (mostly ROC) | 45% | ADD |
"Action" reflects the Academy's own call on each model pick (KEEP / GROW / ADD). Several of this pie's holdings already fit — e.g. UTF and NIE are Bedrock picks; BBDC and FSCO are Cash-Flow picks. The gap isn't the funds — it's the weights. Source: Fynanc Academy PLEX tier model.
6 · What a pie-only view CANNOT see (no login)
This entire read came from a public share link. It's honest about its blind spots — without the account we cannot see:
- Dollar amounts & position sizes — only target % weights, not how much is actually invested.
- Cost basis & unrealized gain/loss — we see a hypothetical +6.63% since Dec 18, 2025, not the real entry prices.
- Realized income actually collected — the 9.78% is a weighted trailing yield, not dollars banked.
- Whether distributions are real income or return-of-capital (ROC) — critical for CEFs/CLOs; needs fund-level data, not the pie.
- Drawdown history & the investor's actual risk experience — the share page shows a short, rosy window only.
- Cash position, contributions, rebalancing behavior, taxes — none of it is in a public pie.
So treat the bucketing as a structural read (what jobs the holdings do), not a statement about this investor's returns or income. We did not request a login, and none is needed for the lesson.
Yield & Risk — answering Amir (live)
This is the live, code-computed answer to the questions Amir's group asks: what is the real blended yield, how deep does it draw down versus the S&P 500, and how much of the "income" is actually return-of-capital? Every number below comes from code (yfinance total-return + distribution data), not estimates. Computed 2026-06-11T10:50:00.119806+00:00.
1 · Weighted yield. Headline 10.44% (sanity-capped) · raw uncapped 13.36% · coverage 100.0% (53/53 holdings priced). The raw figure includes data-feed outliers (GPIQ (65.0%), GPIX (102.0%)) that breach the 50.0% sanity cap; the headline figure caps those, so it is the honest one to quote.
2 · Drawdown vs the S&P 500 (total-return, window 2023-06-12 → 2026-06-10; benchmark SPY).
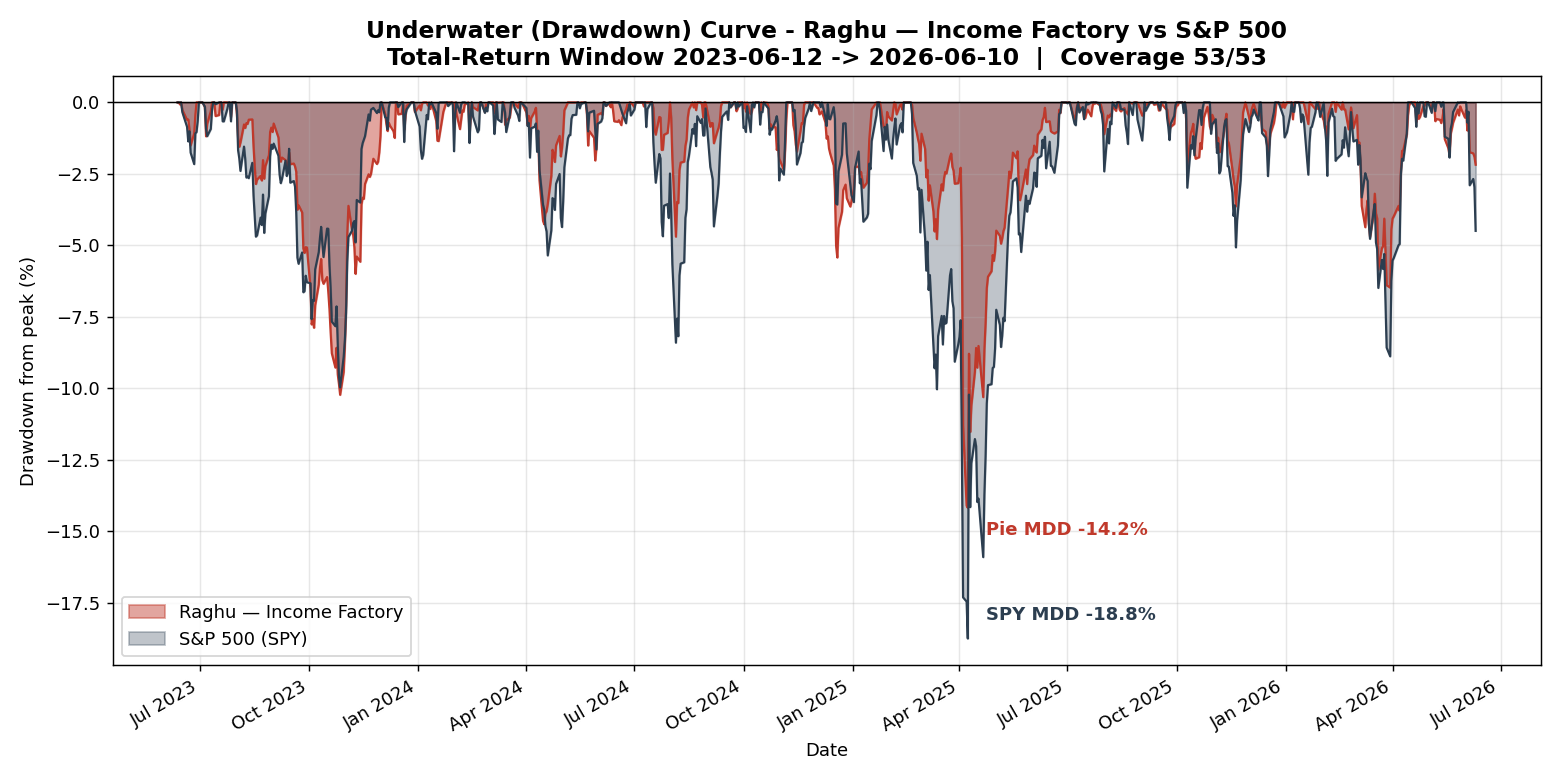
| Metric | This portfolio | S&P 500 (SPY) |
|---|---|---|
| Max drawdown | -14.18% | -18.76% |
| Annualized volatility | 10.8% | 15.2% |
| Total return (window) | 54.8% | 73.78% |
| Sharpe (rf=0) | 1.412 | 1.296 |
| Beta vs SPY | 0.596 | 1.00 |
| Correlation vs SPY | 0.838 | 1.00 |
Honest caveat: 5 holding(s) have less than the full window of price history (MLPI, OTF, MSDL, GPIQ, GPIX); the engine renormalizes weights daily so each ticker only counts from its own start date — no fabricated history. Coverage 53/53, all priced.
3 · Income quality — how much is really earned vs return-of-capital? (total-return-coverage proxy; LIKELY-ROC = distribution rate exceeds 1y total return by >3pp. Coverage 100.0%.)
Earned 55.0% · Mixed 12.0% · Likely-ROC 33.0% (by portfolio weight)
Riskiest high-yield holdings (payout outran earnings — NAV-erosion signal):
| Ticker | Fund | Wt | Dist rate | Total ret 1y | Why flagged |
|---|---|---|---|---|---|
| OXLC | Oxford Lane Capital (CLO equity) | 1% | 54.3% | -41.88% | dist rate 54.3% exceeds total return -41.9% by 96.2pp — payout outran earnings (NAV-erosion signal) |
| XFLT | XAI Octagon Floating Rate & Alt Income | 1% | 23.37% | -26.43% | dist rate 23.4% exceeds total return -26.4% by 49.8pp — payout outran earnings (NAV-erosion signal) |
| GOF | Guggenheim Strategic Opportunities | 2% | 21.65% | -12.74% | dist rate 21.6% exceeds total return -12.7% by 34.4pp — payout outran earnings (NAV-erosion signal) |
| BCSF | Bain Capital Specialty Finance | 2% | 18.33% | -5.9% | dist rate 18.3% exceeds total return -5.9% by 24.2pp — payout outran earnings (NAV-erosion signal) [BDC: distributions funded by NII; total-return coverage used as proxy — confirm vs NII/earnings in filings] |
| FSCO | FS Credit Opportunities | 2% | 17.66% | -24.83% | dist rate 17.7% exceeds total return -24.8% by 42.5pp — payout outran earnings (NAV-erosion signal) |
Sources: yield from the weighted-yield engine (yfinance distributions, sanity-capped); drawdown/vol/Sharpe/beta from total-return price history vs SPY over the shared 3-year window; income-quality from the distribution-sustainability (ROC) engine. This is a total-return-coverage proxy for ROC, not a read of each fund's official 19(a) notice. Honest by construction: short-history and data-feed outliers are disclosed above, not hidden.
7 · Key terms & sources
| Term | What it means here | Where it's taught (course · session · date) |
|---|---|---|
| Bedrock | Stability bucket — low drawdown, low correlation, low maintenance. The base the portfolio stands on. Target ~65%. | PLEX · "Bedrock Debt-Based Candidates v2.0" · Apr 16, 2025 (PLEX tier model) |
| Cash Flow | The yield engine — accepts NAV erosion & volatility in exchange for high distributions. Target ~34%. | PLEX · Call 2 "PLEX Portfolio" · Feb 2, 2026 (PLEX tier model) |
| Hedge | Tiny asymmetric "insurance" sleeve meant to move opposite the market. Target ~1%. | PLEX · "The Ultimate Hedge Against Inflation" · Sep 2024 |
| CEF | Closed-end fund — fixed share count, often leveraged, can trade at a discount/premium to NAV. Most of this pie. | PLEX · "Income Sources — Advanced: Open-End Funds (Part 2)" |
| BDC | Business Development Company — lends to private mid-market businesses; high yield, equity-like risk. | PLEX · "Qualifying New Income Sources" · May 4, 2022 |
| CLO | Collateralized Loan Obligation — AAA tranche is Bedrock-grade; equity tranche (ECC/OXLC) is high-risk Cash Flow. | PLEX · "Bedrock Debt-Based Candidates v2.0" · Apr 16, 2025 (CLO candidates listed) |
| ROC | Return of capital — a "distribution" that's really your own money back; erodes NAV. The pie can't reveal it. | PLEX · "Income Sources — Advanced: Open-End Funds (Part 2)" |
| NAV erosion | When a fund's per-share value declines over time even as it pays a high yield. | PLEX · "Income Sources — Advanced: Open-End Funds (Part 2)" |
| Correlation / Std deviation | The market-linkage & volatility screens that decide Bedrock vs Cash Flow. | PLEX · "Qualifying New Income Sources" · May 4, 2022 · scored in "Bedrock Candidates v2.0" · Apr 16, 2025 |
Sources (Fynanc Academy):
• PLEX Community Call — "Bedrock Debt-Based Candidates v2.0" (Apr 16, 2025) — selection criteria & the Bedrock guardrails.
• PLEX tier model (Bedrock / Cash-Flow / Hedge targets & model picks) — George Antone / Fynanc PLEX criteria.
• "The Ultimate Hedge Against Inflation" (Sep 2024) — the Hedge-bucket rationale.
Live holdings & weights read from the public M1 "Income Factory" share link.